6.2.15. Monitoring Data (only EINSTEIN plus)
Monitoring data can be used within EINSTEIN for the following purposes:
- Provide additional information for defining the present state
- Define boundary conditions to be used as input in system simulations
- To be used as reference data for the validation of the output of system simulations
Monitoring data are supplied in form of data files containing
- hourly data
- subtotals for periods (e.g. weeks, months, quarters, ...)
6.2.15.1. File formats and file location
Data files for monitoring data have to be located in the APPDATA folder (see Location of application data):
APPDATA/einsteinN.Nplus (N.N = Version number, e.g. einstein2.5plus)On Windows this looks usually like: C:/Users/<UserName>/AppData/Roaming/einstein/einstein2.5plus
On Linux the data folder is: .einstein
The file format of data file has to be csv-format with the TAB as separator
Numbers should be defined using a comma or dot as the decimal separator and (optionally) a space as thousands separator (ISO 31-0 (wikipedia))
Allowed formats: 1234.9 1234,9 1 234,9
Not allowed: 1,234.9 1.234,9 (dot or comma as thousands separator)
The structure of the data depends on whether hourly data or data for periods are used:
hourly data
TIME PAR1 PAR2 (...) 1 (i) 99.9 99.9 (...) 2 99.9 na (ii) (...) (...) (...) (...) (...) 8760 99.9 99.9 (...) TOTAL 99.9 99.9 (...) data for periods
START STOP PAR1 PAR2 (...) 01-01-2017 (i) 31-01-2017 (i) 99.9 99.9 na (ii) 01-02-2017 28-02-2017 99.9 99.9 (...) (...) (...) 99.9 99.9 (...) 01-12-2017 31-12-2017 99.9 99.9 (...) TOTAL (iii) 99.9 99.9 (...) The key words TIME, START, STOP and TOTAL have to be written in capital letters
PAR1, PAR2, ... stands for any descriptive label of your data column
Annotations:
- Data do not necessarily be complete for a full year (hour 1 to 8760 or 01-01-yyyy to 31-12-yyyy).
- Some values may be undefined (any text such as na, n.a., — or an empty cell can be used for this purpose)
- TOTAL refers to the yearly total of a quantity. The row for the TOTAL is optional and can be placed at the beginning or at the end of the data
6.2.15.2. Association of data columns to system parameters
In order to associate data columns within your data files with system parameters please use the following steps:
Step 1: Open the menu Monitoring Data
In this panel you can see the list of already associated data sets. You can edit this table by:
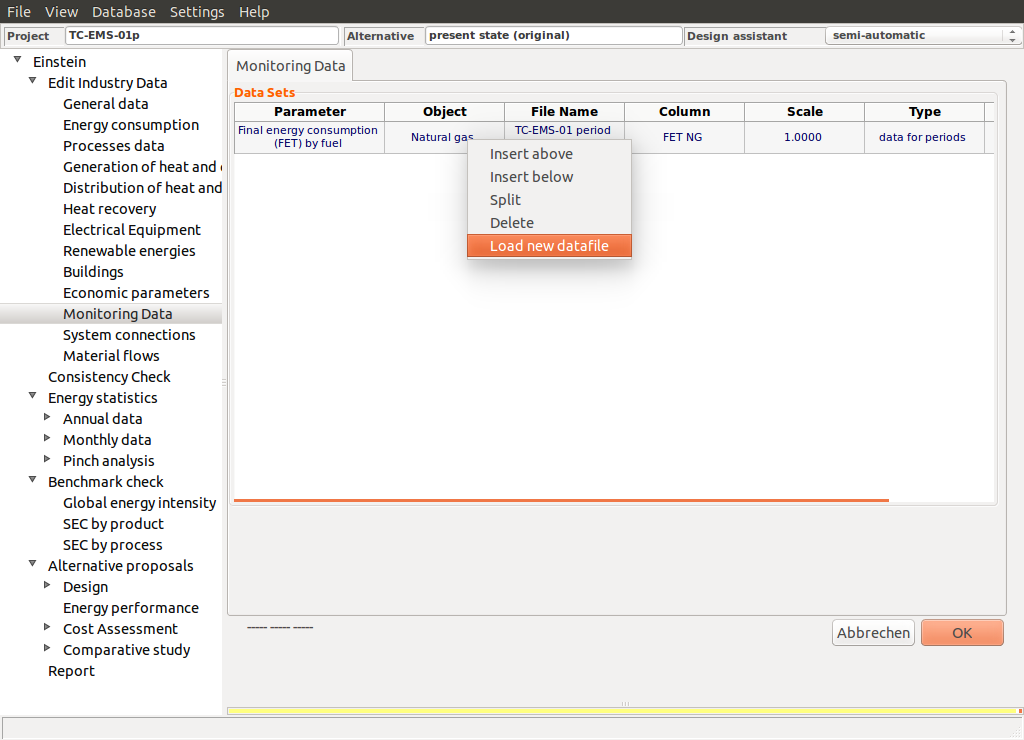
- right-click: insert/delete data sets, add data files
- left-click: change the value of each of the cells

Step 2: Open the data file and select the data column
You can either select an already opened data file in the column “File Name”, or alternatively open a new data file by Right-Click -> Open New Datafile. Once selected the data file, You can choose the data column

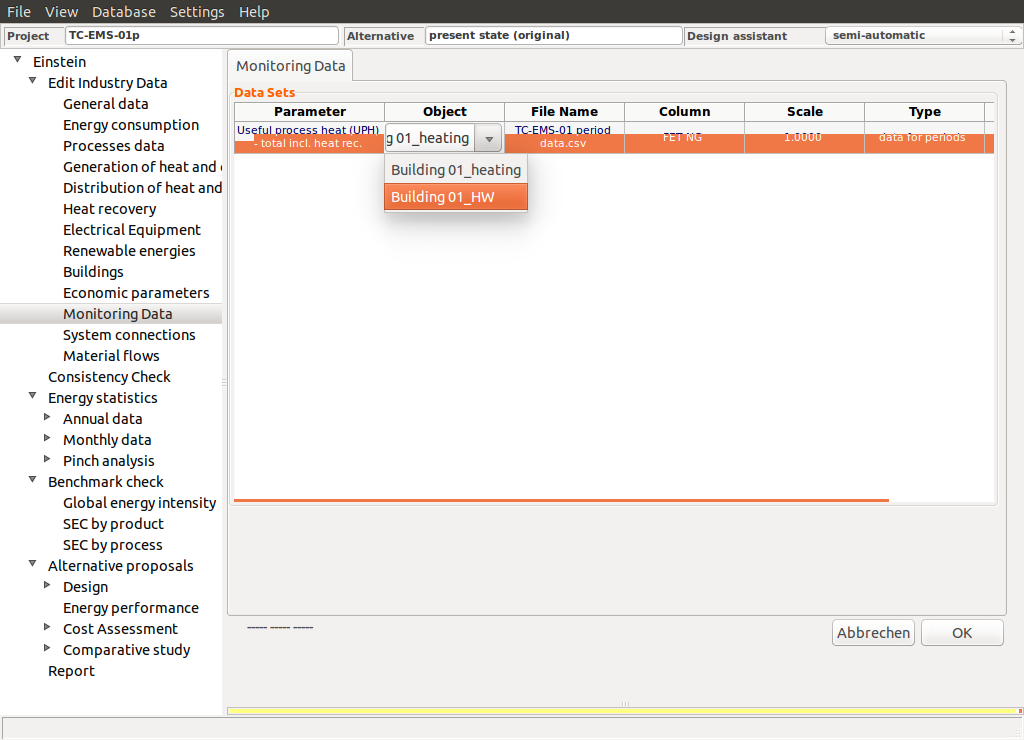
Step 3: Select the system parameter
Within the column “Parameter” you can select several system parameters among
- Fuel and electricity consumption (FEC, FET)
- Energy flows in the equipment (FET, USH)
- Energy flows in heat and cooling distribution (USH, UPHproc)
- Energy and material flows in the processes (UPH, UPHproc)
- Parameters related with material flows within the production process
- Product quantities (material outputs)
- Raw materials (inputs) [not yet active]
- Boundary conditions for the operation of equipment (driving heat and heat rejection temperatures)

Step 4: Select the object in the system
Select the specific object (fuel, equipment, process, ... ) in the column “Object”

Step 5: Click OK to save your changes
6.2.15.3. Use of monitoring data for defining the present state
Associate the data to the corresponding system parameters and then run the consistency and completeness check
Examples:
- If monthly data on fuel consumption are known, EINSTEIN can estimate the distribution of the total heat demand between two consumers (processes) with different seasonal distribution of the demand (e.g. building heating with maximum in winter and hot water demand with a rather constant demand throughout the year)
- If the time schedule of some process is not known, it can be calculated from the hourly profile of heat demand or final energy consumption
- ...
6.2.15.4. Use of monitoring data for defining boundary conditions for simulations
Monitoring data can be used for defining boundary conditions (temperatures) for system simulations.
Currently implemented are the following parameters (for waste heat to power conversion equipment only):
- Driving temperature: inlet temperature of heat supply to the equipment
- Heat rejection temperature: inlet temperature of cooling water or cooling air
Important Note: If monitoring data are used in system simulations, it is not allowed to add or remove equipment or to change the ordering of the equipment in the heat and cooling supply cascade of the system. The configuration of the system has to be the same for all alternatives.
6.2.15.5. Use of monitoring data for validation of the output of system simulations
Not yet implemented in EINSTEIN. Has to be done manually.